How to Fix INP Issue on WordPress in 2026 (Complete Developer’s Guide)
Passing Core Web Vitals in 2026
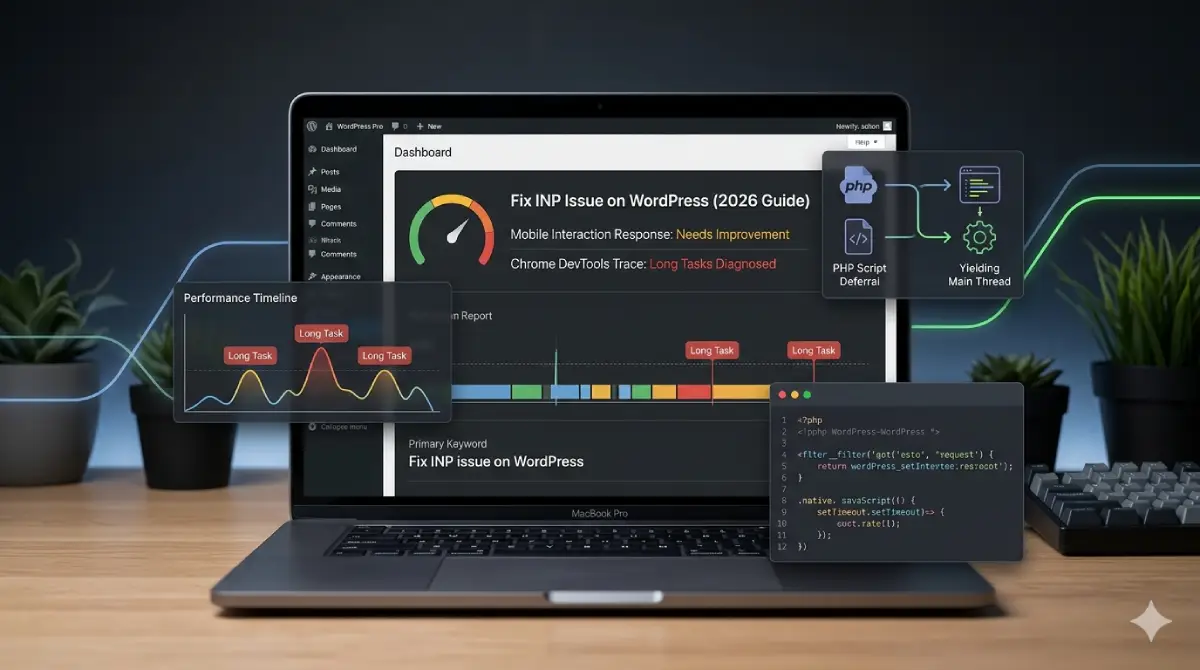
If you want to fix INP issue on WordPress, you must realize that Interaction to Next Paint is no longer a hidden technical metric—it is the single defining factor for your site’s mobile ranking in 2026. Unlike standard loading metrics, INP measures the worst latency a user experiences across their entire page visit, dividing the delay into input lag, processing execution, and rendering cycles. If your site feels fast on load but freezes when a user clicks a button, your main thread is congested.
Quick-Win Blueprint to Pass INP:
- Profile Real Bottlenecks: Isolate tasks exceeding the critical 50ms threshold via Chrome DevTools.
- Targeted Script Deferral: Break down monolithic bundles and selectively defer non-critical JavaScript.
- Main-Thread Yielding: Implement native scheduling and offload tracking scripts to Web Workers via Partytown.
Diagnosing INP Bottlenecks: Field vs. Lab Data
If you want to fix INP issue on WordPress, you must understand that INP measures the worst interaction latency across the entire page visit, not just the initial load time. This metric breaks down into three distinct phases: input delay (the time before the browser starts processing your event), processing time (your JavaScript event handlers executing), and presentation delay (the rendering, layout, and paint cycles after handlers complete). Your optimization strategy depends entirely on which specific phase is causing the bottleneck.
Tracking Down Long Tasks via Chrome DevTools
Open Chrome DevTools → Performance tab → enable Web Vitals lane → record while clicking a button or typing. Here’s the exact workflow:
- Hit Record, trigger the interaction (click, keypress, form input), then stop.
- Locate the INP candidate in the Web Vitals lane; it’s flagged with a red marker.
- Expand the Main thread flame chart directly below it.
- Look for Long Tasks (red-cornered bars exceeding 50ms).
- Drill into Compile Script entries; these represent V8 parsing and compiling JS files on first load. Evaluate Script entries show the runtime execution cost. Both eat directly into processing time.
[INSERT SCREENSHOT: Chrome DevTools Performance Flame Chart highlighting long tasks]
Any single event handler chain exceeding 50ms will push INP into the “needs improvement” range (200ms–500ms). Target processing time first; it’s the most controllable phase in WordPress.
CrUX Dashboard vs. PageSpeed Insights
PageSpeed Insights runs a one-off Lighthouse audit, which is lab data, a single synthetic session. CrUX aggregates real-user measurements from Chrome users over 28 days. An INP of 140ms in Lighthouse means nothing if your 75th-percentile CrUX INP is 620ms.
Check your field INP directly: open PageSpeed Insights, paste your URL, and scroll to Discover what your real users are experiencing. The INP value shown there is your actual target, not the lab score.
Real-Time Logging with PerformanceObserver API
Paste this into your browser console or load it as a deferred inline script:
javascript
const observer = new PerformanceObserver((list) => {
  for (const entry of list.getEntries()) {
    if (entry.duration > 200) {
      console.warn(`Slow interaction: ${entry.name} | Duration: ${entry.duration.toFixed(1)}ms | Target:`, entry.target);
    }
  }
});
observer.observe({ type: 'event', buffered: true, durationThreshold: 50 });
This fires on every interaction exceeding 50ms; the entry.target property tells you exactly which DOM element triggered the slow response. Run this on production with real traffic patterns to catch interactions your DevTools session never exercised.
Main-Thread Yielding: Scheduler API & Long Task Fragmentation
Selective Script Deferral & Custom Architecture
Standard optimization plugins, WP Rocket, Autoptimize, and LiteSpeed Cache, target file size through minification and concatenation. They reduce bytes transferred, but do nothing about when those bytes execute on the main thread. A minified 80KB script that executes synchronously still blocks INP just as effectively as the original.
Target Scripts via script_loader_tag Filter
WordPress has no native defer/async API for enqueued scripts. The correct hook is, script_loader_tag, which filters the final rendered <script> HTML string per handle. Here’s a production-ready implementation:
php
<?php
/**
 * Surgically apply defer/async to specific script handles.
 * Never defer: jquery, jquery-migrate, or any handle
 * with registered inline dependents via wp_localize_script.
 */
function my_defer_async_scripts( $tag, $handle, $src ) {

    $defer_handles = [
        'slick-carousel',
        'contact-form-7',
        'google-recaptcha',
        'wp-embed',
    ];

    $async_handles = [
        'google-analytics',
        'hotjar-tracking',
    ];

    if ( in_array( $handle, $defer_handles, true ) ) {
        return '<script defer src="' . esc_url( $src ) . '"></script>' . "\n";
    }

    if ( in_array( $handle, $async_handles, true ) ) {
        return '<script async src="' . esc_url( $src ) . '"></script>' . "\n";
    }

    return $tag;
}
add_filter( 'script_loader_tag', 'my_defer_async_scripts', 10, 3 );
Before populating $defer_handles, you can use a plugin like Query Monitor or run wp shell in your terminal to inspect the global $wp_scripts->registered object and map every handle’s dependency graph.
Optimizing Script Contexts Natively
One deferred strategy across all page types creates fragile edge cases. WooCommerce checkout, logged-in admin bars, and AMP-adjacent pages each need isolated logic:
php
add_action( 'wp_enqueue_scripts', function() {
    // Dequeue heavy scripts on mobile to save main thread
    if ( wp_is_mobile() && ! is_front_page() ) {
        wp_dequeue_script( 'heavy-desktop-slider' );
    }

    // Completely bypass optimizing checkout pages to prevent breaking gateway scripts
    if ( function_exists( 'is_checkout' ) && is_checkout() ) {
        wp_dequeue_script( 'non-essential-marketing-script' );
    }
} );
Main-Thread Yielding & Task Fragmentation
Deferring script loading is only half the fix. If a deferred script runs a heavy initialization loop once it lands, it still creates a Long Task that blocks interactions. The solution is main-thread yielding, breaking execution into chunks that the browser can interrupt.
javascript
async function runHeavyInit(tasks) {
    for (const task of tasks) {
        task(); // Execute one unit of work

        // Yield: hand control back to browser between each task
        await new Promise(resolve =>
            'scheduler' in window
                ? scheduler.yield().then(resolve)
                : setTimeout(resolve, 0)
        );
    }
}

// Usage: pass an array of initialization functions
runHeavyInit([initSlider, initForms, initTracking]);
Each iteration yields before the next task begins. The browser uses that gap to process any queued user interactions, preventing your initialization work from contributing to INP input delay. Use scheduler.yield() where supported; fall back to setTimeout(resolve, 0) for Safari and Firefox.
Every WordPress page load fires a pile-up of plugin-registered listeners simultaneously, sliders, form validators, analytics bootstraps, all competing for the main thread at DOMContentLoaded. When these stack into a continuous block exceeding 50ms, they form a Long Animation Frame: a period where the browser cannot paint a frame or respond to user input. That cost lands directly in INP.
Offloading Tracking Scripts via Partytown
GA4, Facebook Pixel, and GTM are some of the heaviest Evaluate Script contributors in any WordPress flame chart. Moving them to a Web Worker via Partytown means their execution never touches the main thread; the Worker thread runs in parallel, completely isolated. The main thread stays clear for the one job that controls INP: responding to user interactions immediately.
This is the architectural reason why deferring GA4 with a plugin is insufficient; deferred scripts still execute on the main thread, just later. Partytown removes them from that thread entirely.
Core Cache Optimization Matrix
Apply these settings in LiteSpeed Cache or Perfmatters specifically to target main-thread congestion:
| Asset Optimization Feature | Recommended Setting (2026 INP) | Technical Justification |
|---|---|---|
| JavaScript Combining | TURN OFF | Combining creates monolithic bundles that force a single large Compile Script + Evaluate Script Long Task, blocking the main thread far longer than separate smaller files parsed incrementally |
| JavaScript Deferral / Delay | TURN ON | Pushes non-critical script execution past First Input, reduces input delay phase by ensuring the main thread is idle before plugin JS competes for it |
| DOM Node Minimization | ENABLE | Fewer DOM nodes directly reduce style-recalculation cost triggered on every interaction, cutting presentation delay without touching any JavaScript |
[INSERT SCREENSHOT: Caching Plugin JavaScript Defer & Delay settings panel]
Splitting Tasks on DOMContentLoaded
Stack your plugin initializers through requestIdleCallback instead of firing them synchronously at DOMContentLoaded. This converts one wide LoAF into a sequence of sub-50ms idle-time tasks that the browser schedules around user input:
javascript
const inits = [initSlider, initForms, initPixel];

function runNext(queue) {
    if (!queue.length) return;
    requestIdleCallback(() => {
        queue.shift()();
        runNext(queue);
    }, { timeout: 2000 });
}

document.addEventListener('DOMContentLoaded', () => runNext([...inits]));
The timeout: 2000 argument forces execution within 2 seconds, even if the browser never reaches a genuine idle state, preventing initializers from being indefinitely postponed on low-end devices under heavy load.
Worker Optimization & Caching Strategies
Registering Partytown via wp_footer
Install via npm, copy the /lib directory into your custom plugin folder, and register the inline config plus partytown.js in wp_footer at priority 0 before any third-party script tags render.
Script Migration to Worker Threads
Set type="text/partytown" on every tracking script tag. Declare forward: ["dataLayer.push", "fbq", "gtag"] In the config object, without this, main-thread calls never proxy into the Worker, and data collection silently drops.
Debugging Broken Worker Scripts
Scope permissive CORS headers strictly to Partytown lib files. Exclude partytown.js from WP Rocket minification, a mangled config object is the leading cause of Worker failures in production.
DOM Depth & Native Layout Architecture
Auditing DOM Node Count
Elementor wraps a single widget in five nested divs before content begins. Every interaction triggers style recalculation across that entire tree, structurally unavoidable regardless of script optimization. Run document.querySelectorAll('*').length in console; above 1,500 nodes, interaction cost compounds measurably.
Kadence: Performance-First Architecture
Kadence Blocks outputs one semantic wrapper per component versus Elementor’s five. That 80–90% structural reduction eliminates the style-recalculation overhead at the source. Apply content-visibility: auto on off-screen Kadence sections to defer layout cost for non-visible regions during interactions.
Final INP Audit Checklist
Confirm no Long Task exceeds 50ms in the DevTools processing phase. Validate CrUX 75th-percentile INP below 200ms, not lab score. Deploy, then wait 28 days for field data to confirm ranking signal improvement.
Don’t forget to check out my other step-by-step guides to optimize your digital asset:
- 👉 Essential Roadmap: Design Website for Beginners: The Complete Beginner’s Handbook
- 👉 Developer Tools: Best Online React Compiler 2026: Build & Deploy React Instantly
- 👉 Monetization Strategy: Google AdSense for WordPress: Maximize Your Revenue 2026
Conclusion
Great SEO and low INP scores are not achieved by patching bad code with aggressive plugin configurations; they are the result of clean engineering integrity from DOM architecture through thread management. Build it right structurally, and the Core Web Vitals follow permanently.